Frequency Response Testing in the Anechoic Chamber
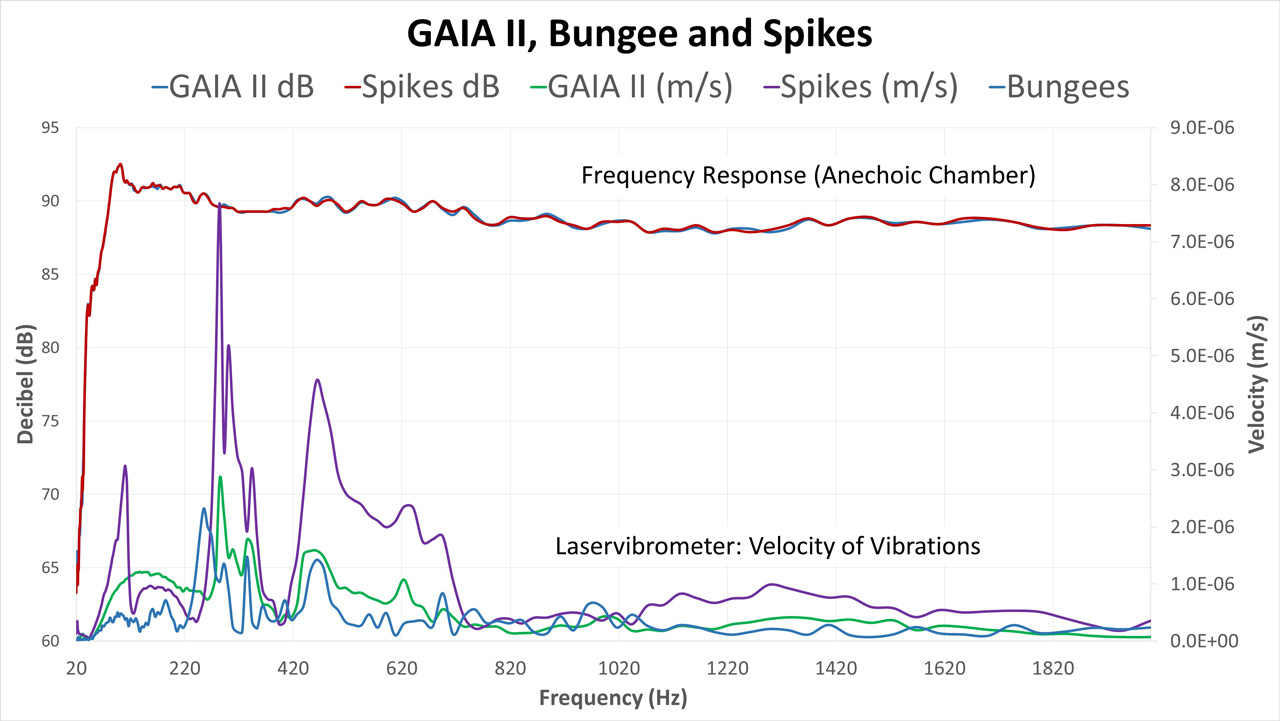
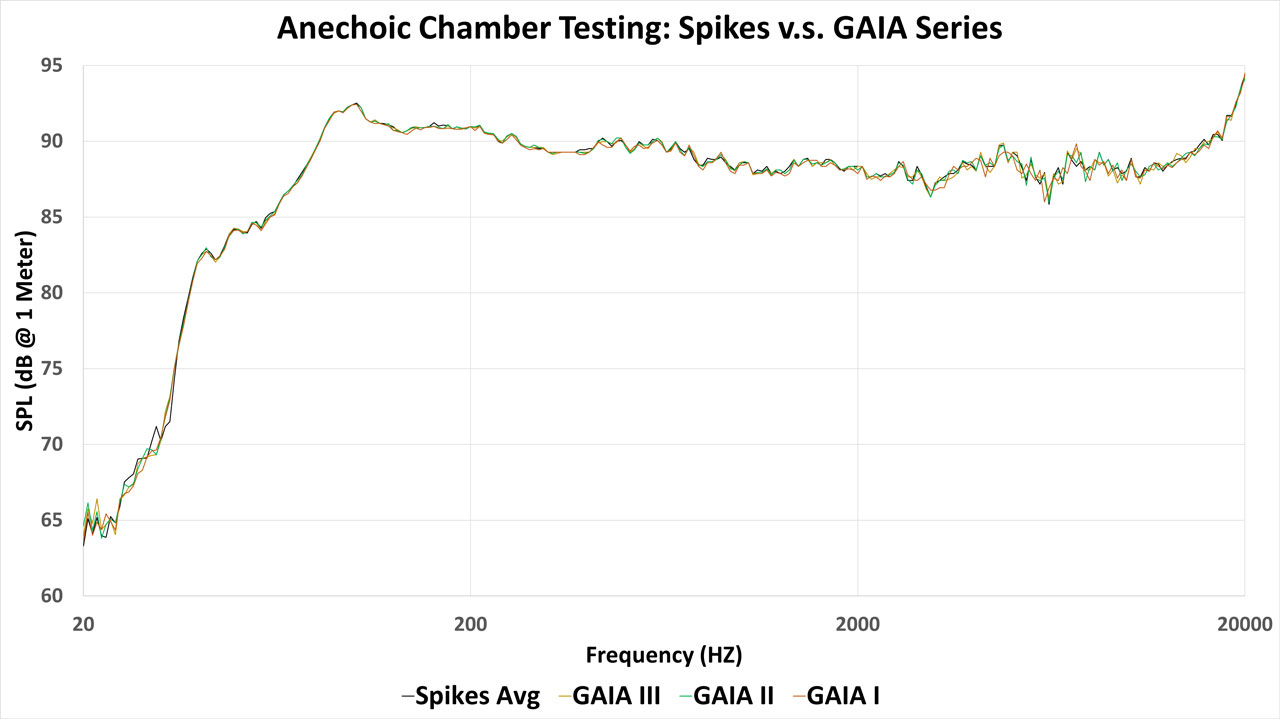
There is a common misconception that isolation can result in a loss in output in the lower frequencies. Testing completed in the Anechoic Chamber at the NRC measured the decibel level output at various frequencies when using IsoAcoustics products and using spikes. The results using both IsoAcoustics isolation and spikes are compared on figure 4. The testing concludes that there was no colorization when using the GAIA isolators. The decibel output is consistent between spikes and the GAIA’s through the tested frequencies ranging from 20 Hz to 20 kHz. One of the IsoAcoustics fundamental principles is to ensure sound accuracy and no colorization.
Laservibrometer: Laser Scanning Vibrometry
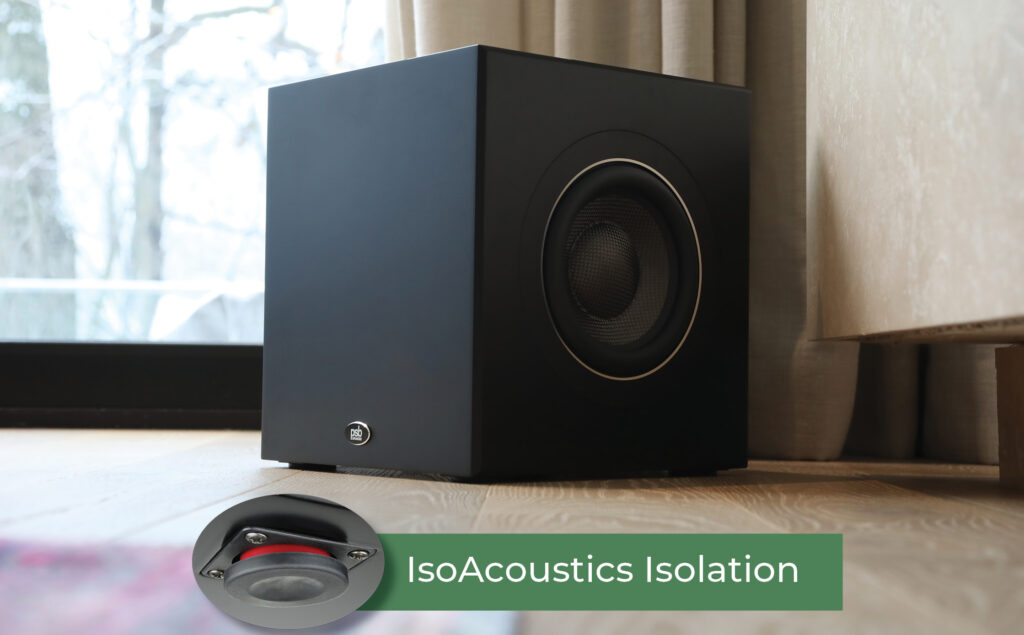
The Laservibrometer is an instrument that is used to make vibration measurements of a surface. Laser scanning vibrometry rapidly scans point-by-point over the test object’s surface to measure vibration levels at various points. The results of the laser scanning vibrometry are shown in figure 5 which helps to illustrate how IsoAcoustics manages the energy of the speaker and reduces the transfer of resonant energy from speaker to the supporting surface.
IsoAcoustics products are designed and tested to provide a high degree of speaker isolation to greatly reduce the symptoms associated with the transfer of resonant energy from the speaker to the supporting surfaces.
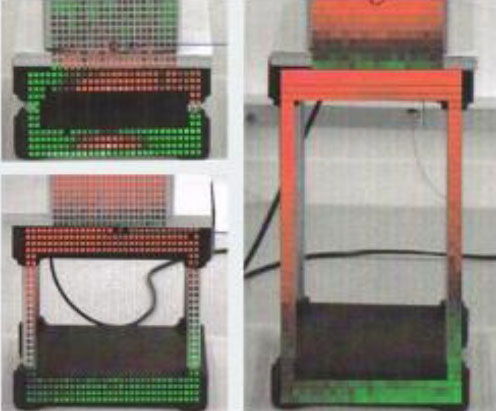 Fig. 5
Measuring Vibrations: IsoAcoustics vs Spikes
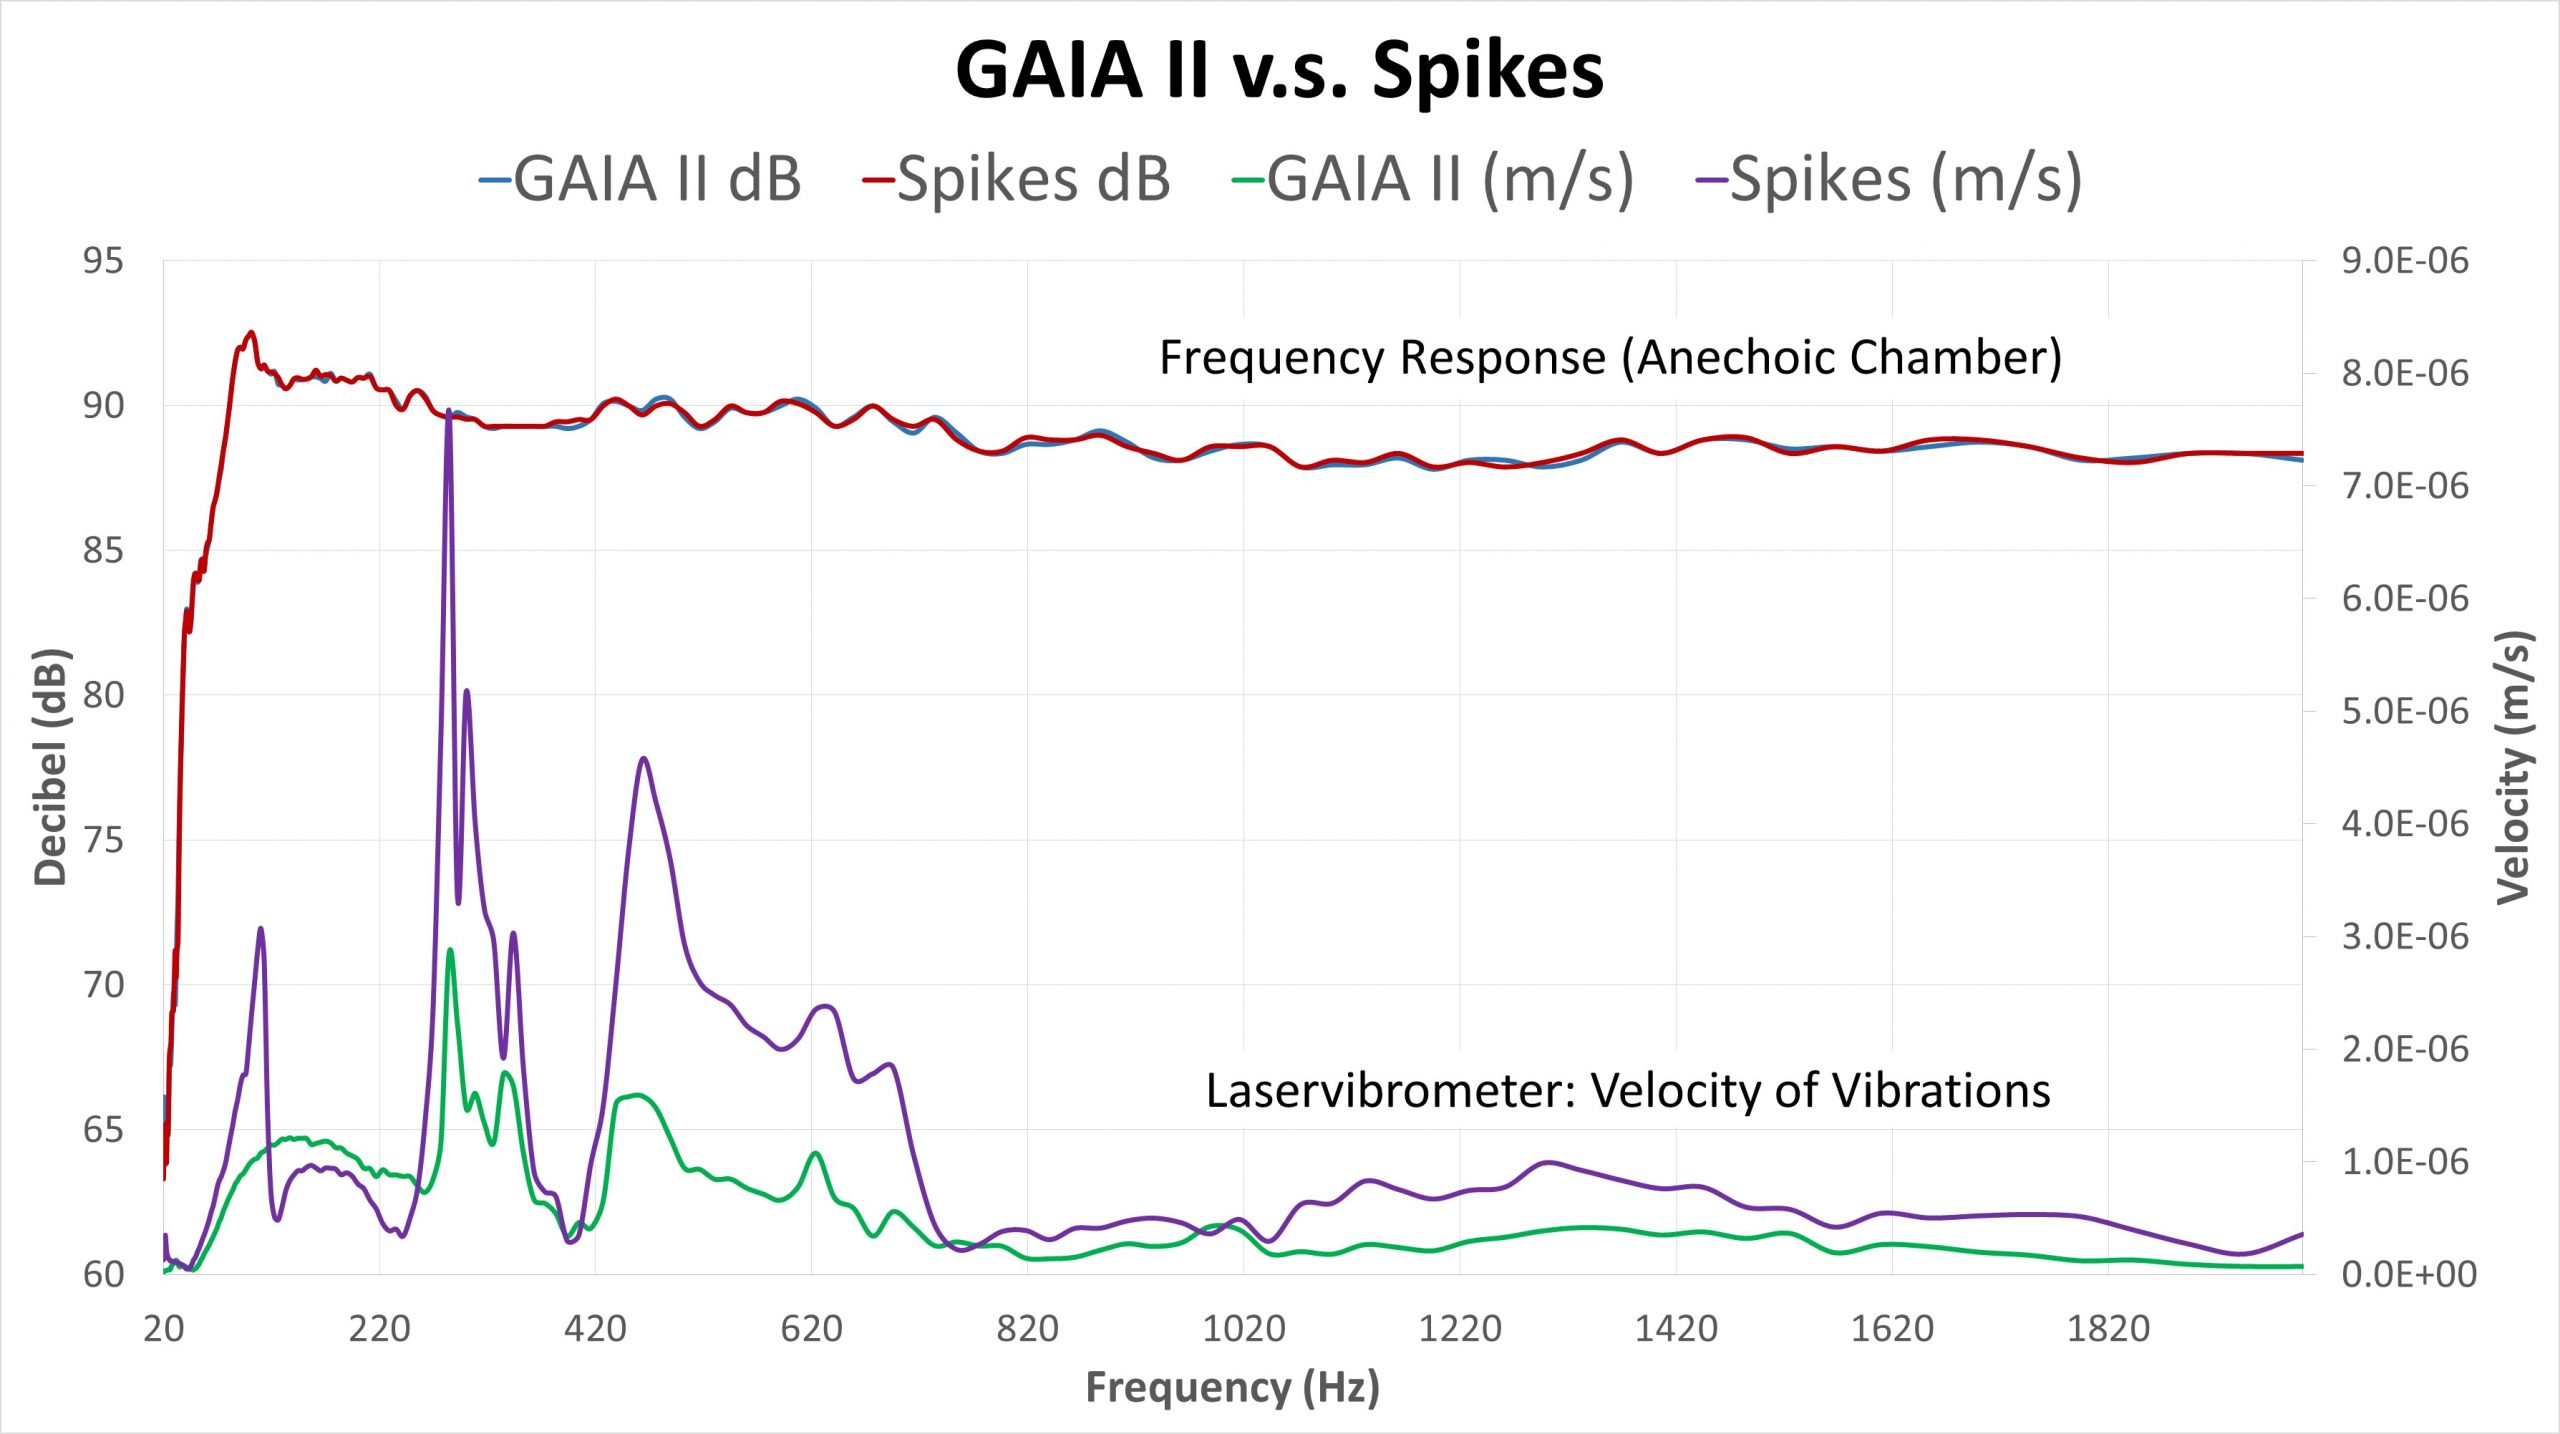
Figure 6 compares the velocity of the vibrations on spikes and on GAIA isolators. This example shows results through frequencies from 20 Hz to 2 kHz. The velocity represents the speed of the vibrations measured in meters per second.
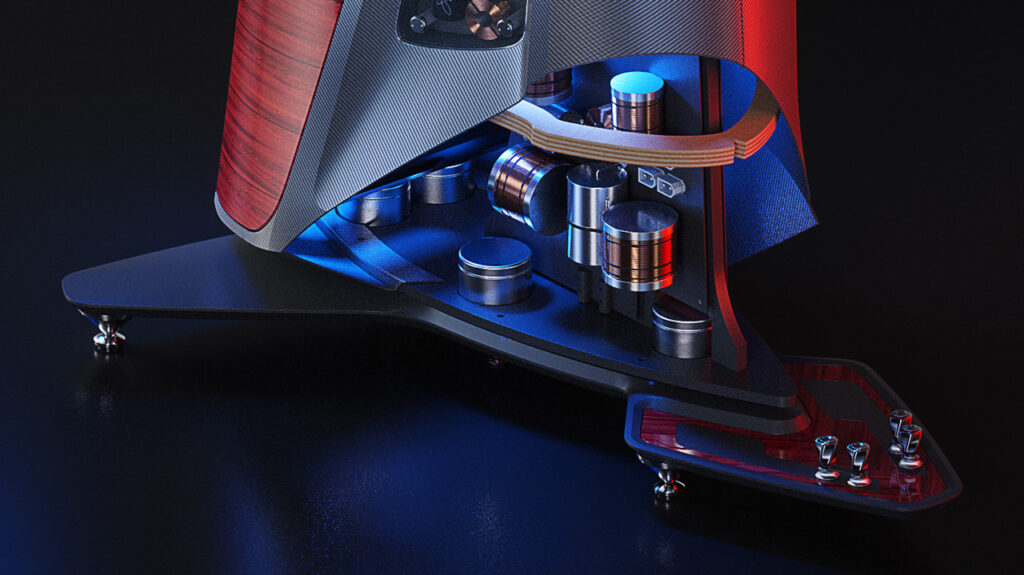
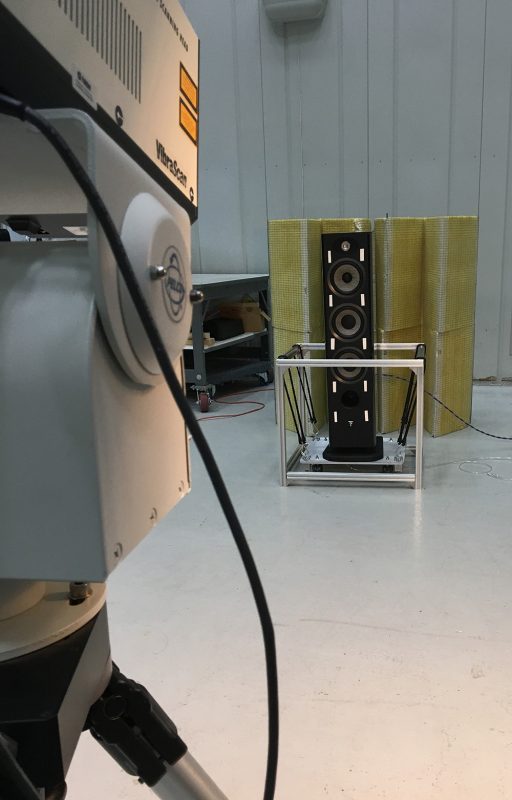
Figure 6 is a photo of the setup used at the NRC to test the GAIA’s and spikes with the laservibrometer.
Summary:
- The velocity of the speaker vibrations are measured in m/s which is located on the secondary Y-axis on the right side of the graph.
- The purple line represents the velocity of the vibrations of the speaker with the speakers mounted on spikes.
- The green line represents the velocity of the vibrations with the speakers mounted on the IsoAcoustics isolation feet.
- Results of the frequency response testing in the Anechoic Chamber are charted on the same graph. The decibel levels are shown on the Y-axis located on the left side of the graph.
The graph shows that the velocity of the vibrations were significantly lower when the GAIA isolators were installed on the speakers. The change in the levels of the vibrations was also smoother as the output of the speaker traveled through the range of frequencies. The reduction of vibration is related to the boundary condition which is explained next.
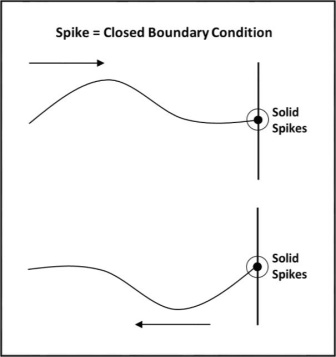
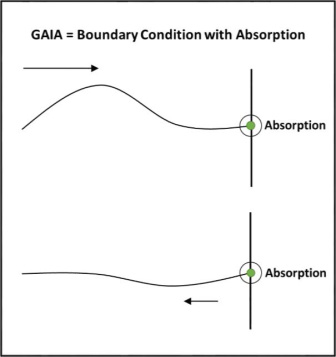
Closed Boundary Conditions vs Boundary Conditions with Absorption
The reduction in vibrations can be explained by the way that IsoAcoustics isolation manages the energy of the speaker to reduce internal reflections. The vibrations when spikes are used is greater in comparison because the vibrations are hitting the solid surface and conducted back to create internal reflections. This is referred to as a closed boundary condition and is illustrated in figure 8. To help visualize this, imagine throwing a large rock into a swimming pool. The ripples hit the hard edges and converge again as we are about to throw the next rock. In this example, we can eliminate the internal reflections by making the pool infinitely large. The IsoAcoustics isolation technology is reducing the internal reflections similar to eliminating the reflections in a swimming pool by removing the edges. The IsoAcoustics isolation technology provides a boundary condition with absorption to greatly reduce the reflections. The effects of the boundary condition with absorption using IsoAcoustics are illustrated in Figure 9.
Measuring Vibrations: Speakers suspended on bungee cords to provide baseline
In order to test how much vibration is inherent in the speaker and how much is related to the boundary condition, the testing was repeated with the speakers suspended on bungee cords to remove the connection to the supporting surface.
The speakers were tested on the GAIA’s and then the test was repeated with the speakers raised onto spikes using solenoids. The test was repeated again with the speaker base suspended by bungee cords. The variation in height was kept to within ¼” (less than ½ a wave length at 20 khz) when changing between spikes, GAIA’s or Bungee. This setup allowed for the testing of each setup while keeping other variables consistent.
Figure 10 compares the velocity of the vibrations on spikes, on GAIA isolators and also with the speakers suspended on bungee cords. The blue line represents the level of vibration that was recorded when the speaker was suspended on bungee cords. The results show that isolation with bungee cords reduced vibrations at a similar level as with the speaker isolated with IsoAcoustics GAIA isolators. The cabinet vibrations of the speakers isolated with GAIA and with Bungee cords resulted in a reduction in cabinet vibrations through the introduction of an absorption layer that reduced secondary reflections.
The bungee cords were very effective at managing the vibrations, but the sound lacked definition and was less sharp. The IsoAcoustics patented design manages the energy on axis to provide improved sound clarity. The IsoAcoustics patented isolation design is explored next.